Australasian Darter
Anhinga novaehollandiae
ABR description
The following is extracted from the Annual Bird Report for the twelve months to June 2017.
Uncommon, breeding resident
Seen foraging in local water-bodies with only its snake-like head and neck exposed, or drying itself in trees on the margins.
General: 1011 records, at a reporting rate of 7.1%, up 92% on the long-term average. Numbers ranged from 1-36, the latter recorded 15 Apr JWNR (SmA1). Recorded in every week, winter 22%, spring 17%, summer 27% and autumn 34%. From 30 grid cells, both urban and rural. 7 breeding records from 5 grid cells, earliest ny/20 Aug Tidbinbilla (CnM1) and the latest ny/4 May Molonglo R (CaJ4). Other breeding sites were, as usual, Molonglo Reach, LBG and JWNR, though no breeding was recorded at the first-named site during COG’s annual field trip there in February (Holland 2017). It is possible that darters are adapting to alternative territories following the clearing of willows and increased human traffic along their traditional haunt of Molonglo Reach. Since 2003, darters have been recorded as breeding every year in our region.
GBS: 39 records this year, at a reporting rate of 1.5% up an astonishing 354% against the long-term average. Numbers ranged from 1-4, average 1.5. They were recorded from 6 urban sites, commonly from LBG and Jerrabomberra, but also occasionally from Giralang, Curtin, and Waramanga. Records came in 28 weeks from Aug to Jun, more commonly in spring 36% and summer 33%.

Abundance
Abundance is the average number of birds of that species per survey. Where the species was observed (presence recorded) but the number of birds seen was not recorded, this is treated as a count of zero.
Abundance by year
This chart shows the abundance of Australasian Darter between 1982 and 2017. 
Abundance by month
This chart shows the monthly abundance of Australasian Darter. The blue lines show the abundance for the twelve months to June 2017 and the bars show the average abundance for the period 1982 to 2017. 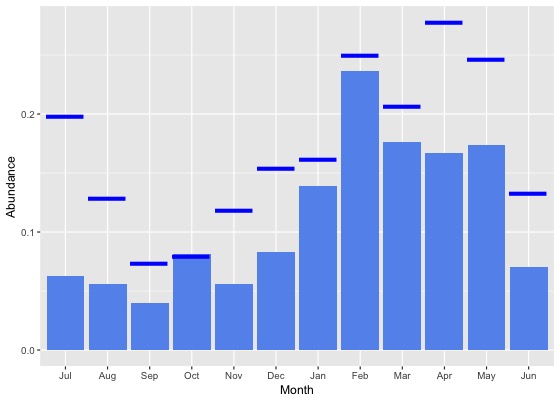
Abundance by season
This chart shows the seasonal abundance of Australasian Darter. The blue lines show the seasonal abundance for the twelve months to June 2017 and the bars show the average seasonal abundance for the period 1982 to 2017. 
Abundance data
| Month | Season | ||||||||||||||||||
|---|---|---|---|---|---|---|---|---|---|---|---|---|---|---|---|---|---|---|---|
| Period | Jul | Aug | Sep | Oct | Nov | Dec | Jan | Feb | Mar | Apr | May | Jun | Winter | Spring | Summer | Autumn | All | ||
| All years | |||||||||||||||||||
| All | 0.1 | 0.1 | 0.0 | 0.1 | 0.1 | 0.1 | 0.1 | 0.2 | 0.2 | 0.2 | 0.2 | 0.1 | 0.1 | 0.1 | 0.1 | 0.2 | 0.1 | ||
| Previous years | |||||||||||||||||||
| All previous years | 0.0 | 0.0 | 0.0 | 0.1 | 0.0 | 0.1 | 0.1 | 0.2 | 0.2 | 0.1 | 0.2 | 0.1 | 0.0 | 0.1 | 0.1 | 0.2 | 0.1 | ||
| Previous 30 years | 0.0 | 0.0 | 0.0 | 0.1 | 0.0 | 0.1 | 0.1 | 0.2 | 0.2 | 0.2 | 0.2 | 0.1 | 0.0 | 0.1 | 0.1 | 0.2 | 0.1 | ||
| Previous 20 years | 0.1 | 0.0 | 0.0 | 0.1 | 0.1 | 0.1 | 0.2 | 0.3 | 0.2 | 0.2 | 0.2 | 0.1 | 0.1 | 0.1 | 0.2 | 0.2 | 0.1 | ||
| 10 year groups | |||||||||||||||||||
| [2007,2017) | 0.1 | 0.1 | 0.0 | 0.1 | 0.1 | 0.1 | 0.2 | 0.3 | 0.3 | 0.2 | 0.2 | 0.1 | 0.1 | 0.1 | 0.2 | 0.2 | 0.1 | ||
| [1997,2007) | 0.0 | 0.0 | 0.0 | 0.0 | 0.0 | 0.0 | 0.1 | 0.1 | 0.1 | 0.1 | 0.2 | 0.0 | 0.0 | 0.0 | 0.1 | 0.1 | 0.1 | ||
| [1987,1997) | 0.0 | 0.0 | 0.0 | 0.1 | 0.0 | 0.0 | 0.0 | 0.0 | 0.1 | 0.0 | 0.0 | 0.0 | 0.0 | 0.0 | 0.0 | 0.0 | 0.0 | ||
| 5 year groups | |||||||||||||||||||
| [2012,2017) | 0.1 | 0.1 | 0.1 | 0.1 | 0.1 | 0.1 | 0.1 | 0.4 | 0.2 | 0.2 | 0.2 | 0.1 | 0.1 | 0.1 | 0.2 | 0.2 | 0.1 | ||
| [2007,2012) | 0.0 | 0.0 | 0.0 | 0.1 | 0.1 | 0.1 | 0.2 | 0.2 | 0.3 | 0.2 | 0.1 | 0.0 | 0.0 | 0.1 | 0.1 | 0.2 | 0.1 | ||
| [2002,2007) | 0.0 | 0.0 | 0.0 | 0.0 | 0.0 | 0.1 | 0.2 | 0.2 | 0.1 | 0.2 | 0.4 | 0.0 | 0.0 | 0.0 | 0.1 | 0.2 | 0.1 | ||
| [1997,2002) | 0.0 | 0.0 | 0.0 | 0.0 | 0.0 | 0.0 | 0.1 | 0.1 | 0.0 | 0.0 | 0.0 | 0.0 | 0.0 | 0.0 | 0.0 | 0.0 | 0.0 | ||
| [1992,1997) | 0.0 | 0.1 | 0.0 | 0.0 | 0.1 | 0.0 | 0.0 | 0.0 | 0.1 | 0.0 | 0.0 | 0.0 | 0.0 | 0.0 | 0.0 | 0.1 | 0.0 | ||
| [1987,1992) | 0.0 | 0.0 | 0.0 | 0.1 | 0.0 | 0.0 | 0.0 | 0.0 | 0.0 | 0.0 | 0.0 | 0.0 | 0.0 | 0.0 | 0.0 | 0.0 | 0.0 | ||
| Year | |||||||||||||||||||
| 2017 | 0.2 | 0.1 | 0.1 | 0.1 | 0.1 | 0.2 | 0.2 | 0.2 | 0.2 | 0.3 | 0.2 | 0.1 | 0.1 | 0.1 | 0.2 | 0.2 | 0.2 | ||
| 2016 | 0.1 | 0.1 | 0.1 | 0.1 | 0.1 | 0.1 | 0.1 | 0.2 | 0.1 | 0.2 | 0.2 | 0.1 | 0.1 | 0.1 | 0.1 | 0.2 | 0.1 | ||
| 2015 | 0.2 | 0.1 | 0.1 | 0.1 | 0.0 | 0.1 | 0.1 | 0.2 | 0.1 | 0.2 | 0.3 | 0.1 | 0.1 | 0.1 | 0.1 | 0.2 | 0.1 | ||
| 2014 | 0.1 | 0.0 | 0.0 | 0.1 | 0.0 | 0.0 | 0.1 | 0.3 | 0.3 | 0.2 | 0.2 | 0.2 | 0.1 | 0.1 | 0.1 | 0.3 | 0.1 | ||
| 2013 | 0.0 | 0.0 | 0.0 | 0.1 | 0.2 | 0.2 | 0.4 | 0.7 | 0.5 | 0.5 | 0.3 | 0.0 | 0.0 | 0.1 | 0.4 | 0.5 | 0.3 | ||
| 2012 | 0.0 | 0.0 | 0.0 | 0.1 | 0.1 | 0.2 | 0.3 | 1.2 | 0.2 | 0.0 | 0.1 | 0.0 | 0.0 | 0.1 | 0.4 | 0.1 | 0.2 | ||
| 2011 | 0.1 | 0.0 | 0.1 | 0.2 | 0.0 | 0.1 | 0.1 | 0.1 | 0.3 | 0.0 | 0.0 | 0.0 | 0.0 | 0.1 | 0.1 | 0.1 | 0.1 | ||
| 2010 | 0.0 | 0.0 | 0.1 | 0.1 | 0.0 | 0.1 | 0.2 | 0.3 | 0.4 | 0.0 | 0.2 | 0.0 | 0.0 | 0.1 | 0.2 | 0.2 | 0.1 | ||
| 2009 | 0.1 | 0.1 | 0.0 | 0.1 | 0.1 | 0.1 | 0.2 | 0.4 | 0.5 | 0.2 | 0.1 | 0.0 | 0.1 | 0.1 | 0.2 | 0.3 | 0.2 | ||
| 2008 | 0.0 | 0.1 | 0.0 | 0.1 | 0.1 | 0.0 | 0.2 | 0.3 | 0.4 | 0.1 | 0.2 | 0.1 | 0.0 | 0.1 | 0.1 | 0.2 | 0.1 | ||
| 2007 | 0.0 | 0.0 | 0.0 | 0.1 | 0.0 | 0.1 | 0.2 | 0.2 | 0.1 | 0.5 | 0.2 | 0.1 | 0.0 | 0.0 | 0.1 | 0.3 | 0.1 | ||
| 2006 | 0.0 | 0.0 | 0.1 | 0.0 | 0.0 | 0.0 | 0.5 | 0.2 | 0.2 | 0.4 | 0.2 | 0.0 | 0.0 | 0.0 | 0.2 | 0.2 | 0.1 | ||
| 2005 | 0.0 | 0.0 | 0.0 | 0.0 | 0.0 | 0.2 | 0.3 | 0.9 | 0.1 | 0.0 | 0.4 | 0.0 | 0.0 | 0.0 | 0.4 | 0.2 | 0.1 | ||
| 2004 | 0.0 | 0.0 | 0.0 | 0.0 | 0.0 | 0.0 | 0.2 | 0.1 | 0.1 | 0.1 | 0.6 | 0.1 | 0.1 | 0.0 | 0.1 | 0.2 | 0.1 | ||
| 2003 | 0.0 | 0.0 | 0.0 | 0.0 | 0.0 | 0.0 | 0.0 | 0.0 | 0.0 | 0.2 | 0.4 | 0.0 | 0.0 | 0.0 | 0.0 | 0.2 | 0.1 | ||
| 2002 | 0.0 | 0.0 | 0.0 | 0.1 | 0.0 | 0.1 | 0.2 | 0.0 | 0.1 | 0.0 | 0.0 | 0.0 | 0.0 | 0.0 | 0.1 | 0.1 | 0.0 | ||
| 2001 | 0.0 | 0.0 | 0.0 | 0.0 | 0.0 | 0.0 | 0.0 | 0.1 | 0.0 | 0.0 | 0.0 | 0.0 | 0.0 | 0.0 | 0.0 | 0.0 | 0.0 | ||
| 2000 | 0.0 | 0.0 | 0.0 | 0.0 | 0.0 | 0.0 | 0.0 | 0.1 | 0.0 | 0.0 | 0.0 | 0.0 | 0.0 | 0.0 | 0.0 | 0.0 | 0.0 | ||
| 1999 | 0.1 | 0.1 | 0.1 | 0.0 | 0.0 | 0.0 | 0.0 | 0.0 | 0.0 | 0.0 | 0.0 | 0.0 | 0.1 | 0.0 | 0.0 | 0.0 | 0.0 | ||
| 1998 | 0.1 | 0.0 | 0.0 | 0.0 | 0.0 | 0.0 | 0.4 | 0.2 | 0.0 | 0.0 | 0.0 | 0.0 | 0.0 | 0.0 | 0.2 | 0.0 | 0.1 | ||
| 1997 | 0.0 | 0.0 | 0.0 | 0.1 | 0.0 | 0.0 | 0.0 | 0.0 | 0.0 | 0.1 | 0.0 | 0.0 | 0.0 | 0.0 | 0.0 | 0.0 | 0.0 | ||
| 1996 | 0.0 | 0.1 | 0.0 | 0.0 | 0.0 | 0.0 | 0.0 | 0.0 | 0.4 | 0.1 | 0.0 | 0.0 | 0.0 | 0.0 | 0.0 | 0.2 | 0.1 | ||
| 1995 | 0.0 | 0.0 | 0.0 | 0.0 | 0.0 | 0.0 | 0.0 | 0.1 | 0.0 | 0.0 | 0.0 | 0.0 | 0.0 | 0.0 | 0.0 | 0.0 | 0.0 | ||
| 1994 | 0.0 | 0.0 | 0.0 | 0.0 | 0.0 | 0.0 | 0.0 | 0.0 | 0.0 | 0.0 | 0.0 | 0.1 | 0.0 | 0.0 | 0.0 | 0.0 | 0.0 | ||
| 1993 | 0.0 | 0.0 | 0.0 | 0.0 | 0.1 | 0.0 | 0.0 | 0.1 | 0.0 | 0.0 | 0.0 | 0.0 | 0.0 | 0.0 | 0.0 | 0.0 | 0.0 | ||
| 1992 | 0.1 | 0.4 | 0.2 | 0.1 | 0.3 | 0.2 | 0.2 | 0.0 | 0.1 | 0.1 | 0.0 | 0.1 | 0.2 | 0.2 | 0.1 | 0.0 | 0.1 | ||
| 1991 | 0.0 | 0.1 | 0.1 | 1.0 | 0.0 | 0.0 | 0.1 | 0.0 | 0.0 | 0.0 | 0.0 | 0.0 | 0.0 | 0.4 | 0.0 | 0.0 | 0.1 | ||
| 1990 | 0.0 | 0.0 | 0.0 | 0.0 | 0.0 | 0.0 | 0.0 | 0.0 | 0.0 | 0.1 | 0.1 | 0.1 | 0.0 | 0.0 | 0.0 | 0.1 | 0.0 | ||
| 1989 | 0.0 | 0.0 | 0.0 | 0.0 | 0.0 | 0.0 | 0.0 | 0.0 | 0.0 | 0.0 | 0.0 | 0.0 | 0.0 | 0.0 | 0.0 | 0.0 | 0.0 | ||
| 1988 | 0.0 | 0.0 | 0.0 | 0.0 | 0.0 | 0.0 | 0.0 | 0.1 | 0.0 | 0.0 | 0.0 | 0.0 | 0.0 | 0.0 | 0.0 | 0.0 | 0.0 | ||
| 1987 | 0.1 | 0.1 | 0.0 | 0.0 | 0.0 | 0.0 | 0.0 | 0.0 | 0.0 | 0.0 | 0.0 | 0.1 | 0.1 | 0.0 | 0.0 | 0.0 | 0.0 | ||
| 1986 | 0.0 | 0.0 | 0.0 | 0.0 | 0.0 | 0.0 | 0.0 | 0.0 | 0.0 | 0.0 | 0.0 | 0.1 | 0.0 | 0.0 | 0.0 | 0.0 | 0.0 | ||
| 1985 | 0.0 | 0.0 | 0.0 | 0.0 | 0.0 | 0.0 | 0.0 | 0.0 | 0.0 | 0.0 | 0.0 | 0.0 | 0.0 | 0.0 | 0.0 | 0.0 | 0.0 | ||
| 1984 | 0.0 | 0.0 | 0.0 | 0.0 | 0.0 | 0.1 | 0.0 | 0.0 | 0.0 | 0.0 | 0.0 | 0.0 | 0.0 | 0.0 | 0.0 | 0.0 | 0.0 | ||
| 1983 | 0.0 | 0.1 | 0.0 | 0.0 | 0.0 | 0.1 | 0.0 | 0.1 | 0.0 | - | 0.1 | 0.0 | 0.0 | 0.0 | 0.1 | 0.1 | 0.0 | ||
| 1982 | - | 0.0 | - | 0.0 | 0.1 | 0.1 | - | 0.4 | - | 0.1 | - | 0.1 | 0.1 | 0.1 | 0.2 | 0.1 | 0.1 | ||
Reporting rates
Reporting rate is the proportion of all surveys in which the species was present.
Reporting rate by year
This chart shows the reporting rate of Australasian Darter each year between 1982 and 2017. 
Reporting rate by month
This chart shows the reporting rate by month of Australasian Darter. The blue lines show the reporting rate for the twelve months to June 2017 and the bars show the average reporting rate for the period 1982 to 2017. 
Reporting rate by season
This chart shows the seasonal reporting rate of Australasian Darter. The blue lines show the seasonal reporting rate for the twelve months to June 2017 and the bars show the average seasonal reporting rate for the period 1982 to 2017. 
Reporting rate data
| Month | Season | ||||||||||||||||||
|---|---|---|---|---|---|---|---|---|---|---|---|---|---|---|---|---|---|---|---|
| Period | Jul | Aug | Sep | Oct | Nov | Dec | Jan | Feb | Mar | Apr | May | Jun | Winter | Spring | Summer | Autumn | All | ||
| All years | |||||||||||||||||||
| All | 3.5 | 3.1 | 2.4 | 3.1 | 3.2 | 3.9 | 5.5 | 6.1 | 4.7 | 5.0 | 6.4 | 3.8 | 3.5 | 2.9 | 5.1 | 5.2 | 4.2 | ||
| Previous years | |||||||||||||||||||
| All previous years | 2.8 | 2.5 | 2.1 | 2.9 | 2.8 | 3.5 | 5.2 | 5.7 | 4.2 | 4.4 | 5.3 | 3.0 | 2.8 | 2.7 | 4.7 | 4.6 | 3.7 | ||
| Previous 30 years | 2.9 | 2.5 | 2.2 | 3.0 | 2.9 | 3.5 | 5.3 | 5.7 | 4.3 | 4.4 | 5.4 | 3.0 | 2.8 | 2.7 | 4.8 | 4.6 | 3.7 | ||
| Previous 20 years | 3.4 | 2.7 | 2.3 | 3.2 | 3.4 | 3.9 | 6.0 | 6.6 | 4.7 | 4.8 | 6.5 | 3.2 | 3.1 | 3.0 | 5.4 | 5.2 | 4.2 | ||
| 10 year groups | |||||||||||||||||||
| [2007,2017) | 4.3 | 3.1 | 3.0 | 3.5 | 4.4 | 5.0 | 6.3 | 7.9 | 5.8 | 5.3 | 7.0 | 4.0 | 3.8 | 3.6 | 6.3 | 5.9 | 4.9 | ||
| [1997,2007) | 1.8 | 1.8 | 1.0 | 2.2 | 1.4 | 1.9 | 4.7 | 3.5 | 2.2 | 3.6 | 5.4 | 1.6 | 1.7 | 1.6 | 3.2 | 3.4 | 2.5 | ||
| [1987,1997) | 1.1 | 2.0 | 1.3 | 1.3 | 1.1 | 0.9 | 1.3 | 1.5 | 1.9 | 2.5 | 1.1 | 2.1 | 1.7 | 1.2 | 1.2 | 1.9 | 1.5 | ||
| 5 year groups | |||||||||||||||||||
| [2012,2017) | 4.7 | 3.2 | 3.1 | 3.4 | 4.8 | 5.5 | 5.6 | 7.6 | 6.1 | 5.7 | 7.4 | 4.8 | 4.2 | 3.7 | 6.2 | 6.3 | 5.1 | ||
| [2007,2012) | 3.4 | 2.9 | 2.7 | 3.7 | 3.5 | 3.9 | 8.9 | 8.8 | 5.2 | 4.4 | 5.8 | 2.5 | 2.8 | 3.4 | 6.7 | 5.0 | 4.4 | ||
| [2002,2007) | 1.9 | 2.3 | 1.4 | 3.1 | 1.9 | 2.5 | 7.1 | 4.7 | 3.2 | 5.4 | 8.5 | 1.7 | 1.9 | 2.1 | 4.4 | 5.2 | 3.4 | ||
| [1997,2002) | 1.6 | 1.3 | 0.6 | 1.0 | 0.8 | 1.3 | 2.1 | 2.3 | 0.9 | 1.3 | 1.5 | 1.5 | 1.5 | 0.8 | 1.8 | 1.2 | 1.3 | ||
| [1992,1997) | 2.2 | 2.1 | 1.3 | 1.5 | 2.0 | 1.8 | 2.0 | 2.9 | 3.4 | 3.4 | 1.4 | 2.3 | 2.2 | 1.6 | 2.2 | 2.8 | 2.2 | ||
| [1987,1992) | 0.6 | 2.0 | 1.3 | 1.1 | 0.6 | 0.5 | 0.8 | 1.0 | 1.1 | 2.0 | 1.0 | 2.0 | 1.5 | 1.0 | 0.8 | 1.3 | 1.1 | ||
| Year | |||||||||||||||||||
| 2017 | 8.0 | 6.2 | 4.1 | 4.6 | 5.9 | 7.0 | 6.9 | 8.0 | 7.3 | 8.9 | 10.8 | 7.6 | 7.3 | 4.9 | 7.3 | 8.9 | 7.1 | ||
| 2016 | 4.2 | 3.7 | 3.1 | 3.4 | 4.2 | 4.5 | 4.1 | 7.8 | 5.1 | 5.4 | 7.1 | 5.9 | 4.6 | 3.5 | 5.5 | 5.7 | 4.9 | ||
| 2015 | 8.2 | 4.0 | 4.1 | 3.1 | 2.6 | 4.3 | 3.5 | 5.4 | 4.9 | 5.5 | 8.2 | 3.4 | 4.8 | 3.3 | 4.3 | 6.0 | 4.6 | ||
| 2014 | 4.8 | 2.1 | 2.3 | 2.8 | 1.1 | 0.7 | 5.3 | 6.8 | 5.9 | 5.6 | 7.4 | 8.6 | 5.9 | 2.3 | 4.8 | 6.2 | 4.6 | ||
| 2013 | 2.3 | 2.7 | 3.4 | 4.1 | 7.4 | 7.2 | 8.3 | 7.9 | 8.7 | 8.8 | 8.4 | 2.9 | 2.6 | 4.8 | 7.8 | 8.7 | 6.3 | ||
| 2012 | 2.0 | 1.6 | 1.7 | 3.8 | 9.8 | 11.3 | 10.1 | 15.6 | 8.0 | 3.3 | 5.9 | 2.7 | 2.1 | 4.7 | 11.5 | 5.6 | 6.1 | ||
| 2011 | 7.3 | 4.0 | 3.1 | 5.7 | 1.8 | 6.2 | 10.1 | 10.0 | 5.0 | 1.9 | 3.3 | 1.5 | 3.2 | 4.2 | 8.6 | 3.4 | 5.0 | ||
| 2010 | 1.0 | 2.6 | 4.5 | 3.8 | 2.9 | 4.7 | 10.1 | 7.1 | 3.9 | 4.7 | 9.8 | 2.3 | 2.1 | 3.8 | 7.1 | 5.2 | 4.5 | ||
| 2009 | 4.3 | 3.1 | 2.6 | 2.8 | 5.8 | 2.6 | 9.3 | 9.2 | 5.6 | 6.1 | 3.8 | 3.2 | 3.5 | 3.4 | 6.5 | 5.4 | 4.5 | ||
| 2008 | 0.7 | 3.5 | 2.6 | 2.9 | 2.7 | 2.7 | 8.7 | 8.3 | 5.9 | 3.4 | 5.4 | 1.4 | 1.7 | 2.8 | 5.7 | 4.5 | 3.5 | ||
| 2007 | 3.3 | 0.9 | 0.4 | 3.6 | 3.4 | 2.0 | 6.3 | 7.8 | 6.0 | 6.8 | 10.6 | 4.2 | 3.4 | 2.6 | 4.6 | 7.3 | 4.4 | ||
| 2006 | 2.0 | 1.0 | 1.8 | 2.0 | 1.8 | 0.6 | 9.0 | 5.2 | 5.0 | 11.3 | 8.7 | 2.3 | 1.9 | 1.9 | 4.9 | 7.5 | 4.0 | ||
| 2005 | 2.9 | 2.8 | 1.1 | 2.2 | 2.8 | 2.4 | 9.2 | 8.7 | 3.9 | 4.9 | 8.0 | 1.1 | 2.0 | 1.8 | 5.6 | 5.5 | 3.7 | ||
| 2004 | 3.2 | 3.9 | 2.9 | 3.5 | 3.5 | 0.9 | 5.5 | 6.1 | 3.6 | 4.4 | 13.6 | 4.3 | 3.7 | 3.3 | 3.5 | 6.1 | 4.1 | ||
| 2003 | 0.9 | 0.7 | 0.4 | 2.1 | 0.9 | 1.7 | 1.5 | 2.7 | 0.9 | 3.2 | 8.5 | 0.6 | 0.7 | 1.1 | 2.0 | 3.5 | 1.9 | ||
| 2002 | 0.0 | 2.5 | 1.0 | 6.0 | 1.0 | 5.0 | 9.4 | 3.3 | 1.8 | 3.6 | 3.5 | 0.5 | 0.8 | 2.8 | 5.7 | 2.7 | 3.2 | ||
| 2001 | 0.4 | 0.0 | 0.0 | 0.4 | 0.6 | 1.1 | 2.0 | 2.1 | 0.6 | 2.0 | 1.2 | 0.0 | 0.2 | 0.3 | 1.6 | 1.1 | 0.8 | ||
| 2000 | 2.4 | 1.3 | 0.0 | 1.3 | 0.9 | 1.7 | 2.1 | 3.3 | 1.6 | 1.3 | 0.0 | 1.6 | 1.7 | 0.8 | 2.3 | 1.2 | 1.5 | ||
| 1999 | 5.9 | 4.1 | 1.7 | 1.3 | 0.6 | 1.2 | 1.5 | 2.1 | 0.5 | 0.5 | 3.4 | 3.3 | 3.8 | 1.2 | 1.6 | 1.4 | 1.9 | ||
| 1998 | 5.4 | 0.0 | 0.8 | 0.0 | 0.0 | 1.9 | 5.9 | 1.9 | 1.1 | 0.0 | 0.0 | 1.3 | 1.8 | 0.3 | 3.1 | 0.6 | 1.4 | ||
| 1997 | 0.0 | 1.7 | 1.8 | 2.6 | 1.7 | 0.0 | 0.0 | 0.0 | 0.0 | 1.8 | 0.0 | 0.0 | 0.5 | 2.0 | 0.0 | 1.0 | 1.0 | ||
| 1996 | 0.0 | 4.3 | 0.0 | 0.0 | 0.0 | 1.0 | 0.0 | 0.0 | 6.9 | 4.7 | 5.2 | 2.3 | 2.4 | 0.0 | 0.3 | 5.8 | 1.9 | ||
| 1995 | 2.2 | 0.8 | 0.0 | 1.8 | 0.9 | 2.3 | 1.8 | 6.3 | 1.0 | 0.8 | 0.0 | 0.0 | 0.9 | 1.1 | 3.0 | 0.7 | 1.4 | ||
| 1994 | 2.0 | 2.6 | 0.0 | 0.0 | 0.7 | 0.0 | 1.5 | 0.0 | 3.4 | 3.8 | 2.5 | 2.2 | 2.3 | 0.3 | 0.6 | 3.3 | 1.7 | ||
| 1993 | 4.1 | 0.0 | 1.6 | 0.0 | 4.5 | 0.0 | 2.0 | 6.2 | 0.0 | 6.7 | 0.0 | 4.3 | 2.6 | 2.0 | 2.4 | 1.8 | 2.2 | ||
| 1992 | 3.1 | 3.7 | 4.7 | 5.3 | 6.9 | 4.8 | 6.9 | 4.9 | 5.6 | 3.4 | 0.0 | 3.3 | 3.4 | 5.6 | 5.6 | 2.9 | 4.4 | ||
| 1991 | 0.8 | 4.3 | 2.3 | 3.9 | 1.0 | 1.4 | 5.4 | 0.0 | 1.6 | 1.7 | 0.0 | 2.0 | 2.2 | 2.4 | 2.2 | 1.1 | 2.1 | ||
| 1990 | 0.6 | 2.2 | 1.1 | 2.0 | 2.8 | 1.4 | 0.0 | 0.0 | 1.1 | 6.0 | 5.5 | 6.6 | 2.4 | 2.0 | 0.5 | 4.1 | 2.3 | ||
| 1989 | 0.0 | 0.9 | 0.4 | 0.4 | 0.0 | 0.4 | 1.1 | 1.5 | 1.7 | 0.0 | 0.0 | 1.8 | 0.8 | 0.3 | 1.0 | 0.6 | 0.7 | ||
| 1988 | 0.4 | 1.9 | 1.7 | 0.8 | 0.7 | 0.0 | 0.5 | 1.7 | 0.5 | 3.2 | 0.0 | 1.0 | 1.1 | 1.0 | 0.7 | 1.2 | 1.0 | ||
| 1987 | 9.1 | 6.7 | 1.6 | 0.8 | 0.0 | 0.5 | 0.0 | 0.4 | 1.0 | 1.2 | 1.3 | 1.5 | 2.2 | 0.7 | 0.3 | 1.2 | 0.9 | ||
| 1986 | 0.0 | 0.0 | 0.0 | 2.8 | 0.0 | 0.0 | 0.0 | 2.8 | 0.0 | 0.0 | 0.0 | 2.9 | 1.0 | 0.7 | 1.1 | 0.0 | 0.7 | ||
| 1985 | 0.0 | 0.0 | 0.0 | 0.0 | 0.0 | 0.0 | 0.0 | 0.0 | 0.0 | 0.0 | 0.0 | 0.0 | 0.0 | 0.0 | 0.0 | 0.0 | 0.0 | ||
| 1984 | 0.0 | 0.0 | 0.0 | 0.0 | 0.0 | 8.3 | 0.0 | 0.0 | 0.0 | 0.0 | 0.0 | 0.0 | 0.0 | 0.0 | 1.4 | 0.0 | 0.4 | ||
| 1983 | 0.0 | 8.3 | 0.0 | 0.0 | 0.0 | 7.7 | 0.0 | 9.1 | 0.0 | - | 8.3 | 0.0 | 3.4 | 0.0 | 6.7 | 7.1 | 4.0 | ||
| 1982 | - | 0.0 | - | 0.0 | 12.5 | 7.1 | - | 9.1 | - | 7.7 | - | 7.1 | 4.0 | 11.1 | 8.0 | 7.7 | 6.9 | ||
Breeding data
Breeding records by month
Number of breeding records by breeding code and month, 2017 and all years| Breeding code | Jul | Aug | Sep | Oct | Nov | Dec | Jan | Feb | Mar | Apr | May | Jun |
|---|---|---|---|---|---|---|---|---|---|---|---|---|
| 2017 | ||||||||||||
| Breeding (BLA code) | 0 | 0 | 0 | 0 | 1 | 0 | 0 | 0 | 0 | 0 | 0 | 0 |
| Carrying Food | 0 | 0 | 0 | 0 | 0 | 0 | 0 | 0 | 0 | 0 | 0 | 0 |
| Copulating | 0 | 0 | 0 | 0 | 0 | 0 | 0 | 0 | 0 | 0 | 0 | 0 |
| Display | 0 | 0 | 0 | 0 | 0 | 0 | 0 | 0 | 0 | 0 | 0 | 0 |
| Dependent young | 0 | 0 | 0 | 0 | 0 | 0 | 0 | 0 | 0 | 0 | 0 | 0 |
| Faecal sac | 0 | 0 | 0 | 0 | 0 | 0 | 0 | 0 | 0 | 0 | 0 | 0 |
| Inspecting hollow | 0 | 0 | 0 | 0 | 0 | 0 | 0 | 0 | 0 | 0 | 0 | 0 |
| Nest building | 0 | 0 | 0 | 0 | 0 | 0 | 0 | 2 | 0 | 0 | 0 | 0 |
| Nest with eggs | 0 | 0 | 0 | 0 | 0 | 0 | 0 | 0 | 0 | 0 | 0 | 0 |
| Nest with young | 0 | 1 | 0 | 1 | 0 | 1 | 0 | 0 | 0 | 0 | 1 | 0 |
| On/leaving nest | 0 | 0 | 0 | 0 | 0 | 0 | 0 | 0 | 0 | 0 | 0 | 0 |
| All years | ||||||||||||
| Breeding (BLA code) | 0 | 0 | 0 | 2 | 2 | 0 | 1 | 2 | 0 | 1 | 0 | 0 |
| Carrying Food | 0 | 0 | 0 | 0 | 0 | 0 | 0 | 0 | 0 | 0 | 0 | 0 |
| Copulating | 0 | 0 | 0 | 0 | 0 | 0 | 0 | 0 | 0 | 0 | 0 | 0 |
| Display | 0 | 0 | 0 | 0 | 0 | 0 | 0 | 0 | 0 | 0 | 0 | 0 |
| Dependent young | 0 | 0 | 0 | 1 | 1 | 1 | 1 | 4 | 3 | 4 | 10 | 0 |
| Faecal sac | 0 | 0 | 0 | 0 | 0 | 0 | 0 | 0 | 0 | 0 | 0 | 0 |
| Inspecting hollow | 0 | 0 | 0 | 0 | 0 | 0 | 0 | 0 | 0 | 0 | 0 | 0 |
| Nest building | 0 | 0 | 0 | 1 | 0 | 0 | 0 | 2 | 0 | 0 | 0 | 0 |
| Nest with eggs | 0 | 0 | 0 | 0 | 0 | 0 | 0 | 0 | 0 | 0 | 0 | 0 |
| Nest with young | 0 | 1 | 0 | 4 | 1 | 3 | 9 | 6 | 3 | 3 | 7 | 0 |
| On/leaving nest | 0 | 0 | 5 | 13 | 1 | 1 | 3 | 4 | 0 | 1 | 3 | 0 |
Breeding records by year
Average number of breeding records per period by breeding code| Period | Breeding (BLA code) | Carrying Food | Copulating | Display | Dependent young | Faecal sac | Inspecting hollow | Nest building | Nest with eggs | Nest with young | On/leaving nest |
|---|---|---|---|---|---|---|---|---|---|---|---|
| All years | |||||||||||
| All | 0.2 | 0.0 | 0.0 | 0.0 | 0.7 | 0.0 | 0.0 | 0.1 | 0.0 | 1.0 | 0.9 |
| Previous years | |||||||||||
| All previous years | 0.2 | 0.0 | 0.0 | 0.0 | 0.7 | 0.0 | 0.0 | 0.0 | 0.0 | 0.9 | 0.9 |
| Previous 30 years | 0.2 | 0.0 | 0.0 | 0.0 | 0.8 | 0.0 | 0.0 | 0.0 | 0.0 | 1.1 | 1.0 |
| Previous 20 years | 0.3 | 0.0 | 0.0 | 0.0 | 1.2 | 0.0 | 0.0 | 0.0 | 0.0 | 1.6 | 1.5 |
| 10 year groups | |||||||||||
| [2007,2017) | 0.5 | 0.0 | 0.0 | 0.0 | 1.1 | 0.0 | 0.0 | 0.1 | 0.0 | 1.4 | 2.3 |
| [1997,2007) | 0.2 | 0.0 | 0.0 | 0.0 | 1.3 | 0.0 | 0.0 | 0.0 | 0.0 | 1.9 | 0.7 |
| [1987,1997) | 0.0 | 0.0 | 0.0 | 0.0 | 0.1 | 0.0 | 0.0 | 0.0 | 0.0 | 0.0 | 0.1 |
| 5 year groups | |||||||||||
| [2012,2017) | 0.4 | 0.0 | 0.0 | 0.0 | 0.8 | 0.0 | 0.0 | 0.0 | 0.0 | 1.0 | 2.6 |
| [2007,2012) | 0.6 | 0.0 | 0.0 | 0.0 | 1.4 | 0.0 | 0.0 | 0.2 | 0.0 | 1.8 | 2.0 |
| [2002,2007) | 0.4 | 0.0 | 0.0 | 0.0 | 2.6 | 0.0 | 0.0 | 0.0 | 0.0 | 3.6 | 1.2 |
| [1997,2002) | 0.0 | 0.0 | 0.0 | 0.0 | 0.0 | 0.0 | 0.0 | 0.0 | 0.0 | 0.2 | 0.2 |
| [1992,1997) | 0.0 | 0.0 | 0.0 | 0.0 | 0.0 | 0.0 | 0.0 | 0.0 | 0.0 | 0.0 | 0.2 |
| [1987,1992) | 0.0 | 0.0 | 0.0 | 0.0 | 0.2 | 0.0 | 0.0 | 0.0 | 0.0 | 0.0 | 0.0 |
| Year | |||||||||||
| 2017 | 1.0 | 0.0 | 0.0 | 0.0 | 0.0 | 0.0 | 0.0 | 2.0 | 0.0 | 4.0 | 0.0 |
| 2016 | 0.0 | 0.0 | 0.0 | 0.0 | 1.0 | 0.0 | 0.0 | 0.0 | 0.0 | 2.0 | 7.0 |
| 2015 | 0.0 | 0.0 | 0.0 | 0.0 | 1.0 | 0.0 | 0.0 | 0.0 | 0.0 | 0.0 | 1.0 |
| 2014 | 0.0 | 0.0 | 0.0 | 0.0 | 2.0 | 0.0 | 0.0 | 0.0 | 0.0 | 0.0 | 1.0 |
| 2013 | 0.0 | 0.0 | 0.0 | 0.0 | 0.0 | 0.0 | 0.0 | 0.0 | 0.0 | 1.0 | 1.0 |
| 2012 | 2.0 | 0.0 | 0.0 | 0.0 | 0.0 | 0.0 | 0.0 | 0.0 | 0.0 | 2.0 | 3.0 |
| 2011 | 0.0 | 0.0 | 0.0 | 0.0 | 1.0 | 0.0 | 0.0 | 0.0 | 0.0 | 1.0 | 1.0 |
| 2010 | 0.0 | 0.0 | 0.0 | 0.0 | 1.0 | 0.0 | 0.0 | 0.0 | 0.0 | 0.0 | 3.0 |
| 2009 | 2.0 | 0.0 | 0.0 | 0.0 | 3.0 | 0.0 | 0.0 | 0.0 | 0.0 | 1.0 | 0.0 |
| 2008 | 0.0 | 0.0 | 0.0 | 0.0 | 1.0 | 0.0 | 0.0 | 1.0 | 0.0 | 4.0 | 4.0 |
| 2007 | 1.0 | 0.0 | 0.0 | 0.0 | 1.0 | 0.0 | 0.0 | 0.0 | 0.0 | 3.0 | 2.0 |
| 2006 | 0.0 | 0.0 | 0.0 | 0.0 | 2.0 | 0.0 | 0.0 | 0.0 | 0.0 | 3.0 | 1.0 |
| 2005 | 2.0 | 0.0 | 0.0 | 0.0 | 2.0 | 0.0 | 0.0 | 0.0 | 0.0 | 9.0 | 0.0 |
| 2004 | 0.0 | 0.0 | 0.0 | 0.0 | 4.0 | 0.0 | 0.0 | 0.0 | 0.0 | 4.0 | 4.0 |
| 2003 | 0.0 | 0.0 | 0.0 | 0.0 | 4.0 | 0.0 | 0.0 | 0.0 | 0.0 | 2.0 | 1.0 |
| 2002 | 0.0 | 0.0 | 0.0 | 0.0 | 1.0 | 0.0 | 0.0 | 0.0 | 0.0 | 0.0 | 0.0 |
| 2001 | 0.0 | 0.0 | 0.0 | 0.0 | 0.0 | 0.0 | 0.0 | 0.0 | 0.0 | 0.0 | 0.0 |
| 2000 | 0.0 | 0.0 | 0.0 | 0.0 | 0.0 | 0.0 | 0.0 | 0.0 | 0.0 | 0.0 | 0.0 |
| 1999 | 0.0 | 0.0 | 0.0 | 0.0 | 0.0 | 0.0 | 0.0 | 0.0 | 0.0 | 0.0 | 1.0 |
| 1998 | 0.0 | 0.0 | 0.0 | 0.0 | 0.0 | 0.0 | 0.0 | 0.0 | 0.0 | 1.0 | 0.0 |
| 1997 | 0.0 | 0.0 | 0.0 | 0.0 | 0.0 | 0.0 | 0.0 | 0.0 | 0.0 | 0.0 | 0.0 |
| 1996 | 0.0 | 0.0 | 0.0 | 0.0 | 0.0 | 0.0 | 0.0 | 0.0 | 0.0 | 0.0 | 0.0 |
| 1995 | 0.0 | 0.0 | 0.0 | 0.0 | 0.0 | 0.0 | 0.0 | 0.0 | 0.0 | 0.0 | 0.0 |
| 1994 | 0.0 | 0.0 | 0.0 | 0.0 | 0.0 | 0.0 | 0.0 | 0.0 | 0.0 | 0.0 | 1.0 |
| 1993 | 0.0 | 0.0 | 0.0 | 0.0 | 0.0 | 0.0 | 0.0 | 0.0 | 0.0 | 0.0 | 0.0 |
| 1992 | 0.0 | 0.0 | 0.0 | 0.0 | 0.0 | 0.0 | 0.0 | 0.0 | 0.0 | 0.0 | 0.0 |
| 1991 | 0.0 | 0.0 | 0.0 | 0.0 | 0.0 | 0.0 | 0.0 | 0.0 | 0.0 | 0.0 | 0.0 |
| 1990 | 0.0 | 0.0 | 0.0 | 0.0 | 0.0 | 0.0 | 0.0 | 0.0 | 0.0 | 0.0 | 0.0 |
| 1989 | 0.0 | 0.0 | 0.0 | 0.0 | 1.0 | 0.0 | 0.0 | 0.0 | 0.0 | 0.0 | 0.0 |
| 1988 | 0.0 | 0.0 | 0.0 | 0.0 | 0.0 | 0.0 | 0.0 | 0.0 | 0.0 | 0.0 | 0.0 |
| 1987 | 0.0 | 0.0 | 0.0 | 0.0 | 0.0 | 0.0 | 0.0 | 0.0 | 0.0 | 0.0 | 0.0 |
| 1986 | 0.0 | 0.0 | 0.0 | 0.0 | 0.0 | 0.0 | 0.0 | 0.0 | 0.0 | 0.0 | 0.0 |
| 1985 | 0.0 | 0.0 | 0.0 | 0.0 | 0.0 | 0.0 | 0.0 | 0.0 | 0.0 | 0.0 | 0.0 |
| 1984 | 0.0 | 0.0 | 0.0 | 0.0 | 0.0 | 0.0 | 0.0 | 0.0 | 0.0 | 0.0 | 0.0 |
| 1983 | 0.0 | 0.0 | 0.0 | 0.0 | 0.0 | 0.0 | 0.0 | 0.0 | 0.0 | 0.0 | 0.0 |
| 1982 | 0.0 | 0.0 | 0.0 | 0.0 | 0.0 | 0.0 | 0.0 | 0.0 | 0.0 | 0.0 | 0.0 |
Distribution map
Distribution - 2017
This map shows the observed distribution of the Australasian Darter for 2017.
The red circles are the grid cells where Australasian Darter have been reported.
The transparency of the red circles indicate how many surveys sheets were submitted for that grid cell; the darker the red the more reliable the data. Of the 315 grid cells with reports, 83 had only one sheet; an example is grid number A11.
The size of the circle represents the reporting rate. The maximum reporting rate for Australasian Darter was 38.0% (eg grid number L14) and the minimum was 0.1% (eg grid number K15). 
Distribution - all years
This map shows the observed distribution of the Australasian Darter for all years.
The red circles are the grid cells where Australasian Darter have been reported.
The transparency of the red circles indicate how many surveys sheets were submitted for that grid cell; the darker the red the more reliable the data. Of the 703 grid cells with reports, 55 had only one sheet; an example is grid number B5.
The size of the circle represents the reporting rate. The maximum reporting rate for Australasian Darter was 100.0% (eg grid number B5) and the minimum was 0.1% (eg grid number K15). 
Breeding map
Breeding - 2017
This map shows the breeding distribution of the Australasian Darter for 2017.
The red circles are the grid cells where breeding activity for Australasian Darter have been reported.
The size of the circle represents the number of reports. 
Breeding - all years
This map shows the breeding distribution of the Australasian Darter for all years.
The red circles are the grid cells where breeding activity for Australasian Darter have been reported.
The size of the circle represents the number of reports. 